APH Customer Service is closed until Monday, December 2nd.
To ensure gift delivery by 12/25, please place orders via UPS shipping no later than 12/17.
CloseAPH Customer Service is closed until Monday, December 2nd.
To ensure gift delivery by 12/25, please place orders via UPS shipping no later than 12/17.
Close
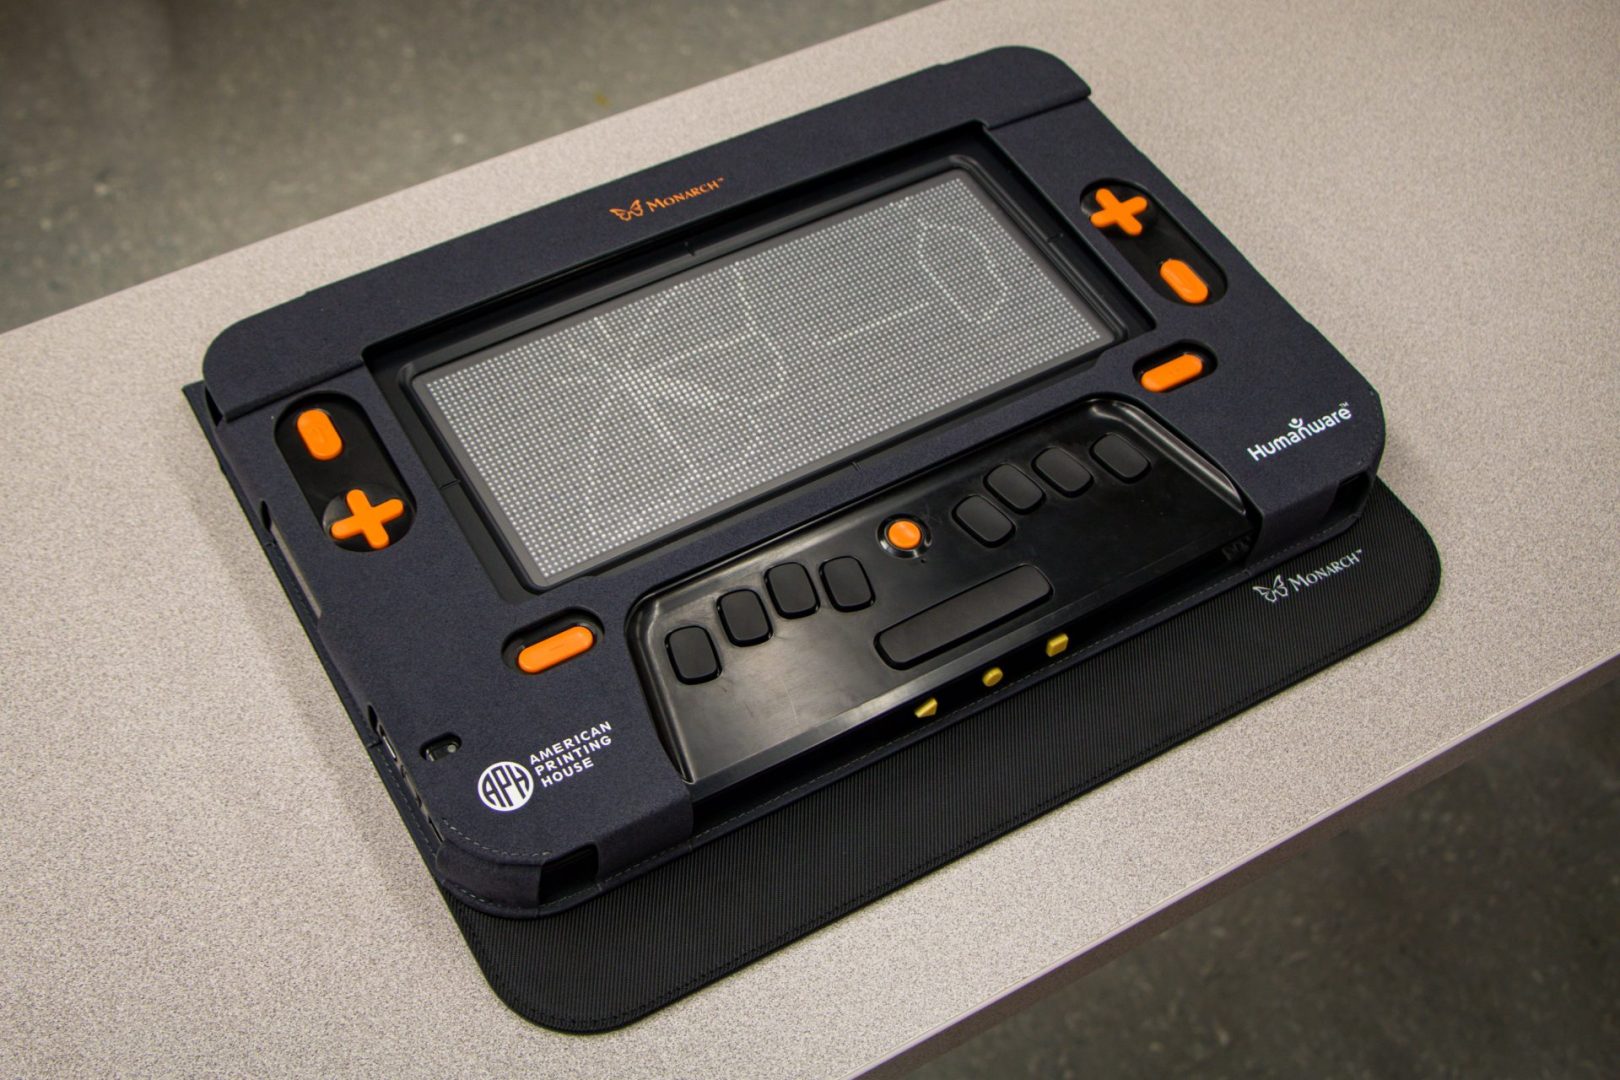
Science classes include a variety of graphics, which can be expensive and slow to produce. APH’s Monarch, is breaking down these access barriers.
Jennifer Bliss, APH Scholar and STEM Consultant for the Iowa Educational Services for the Blind and Visually Impaired (IESBVI), introduced the Monarch to students who were experienced users of tactile graphics and braille notetaker technology. The students were quick to understand navigation and keystrokes on the Monarch. “I put some chemical equations into the KeyWord application on the Monarch using the math equation editor,” said Jennifer. “All of the parentheses, subscripts, superscripts, and arrows can take up multiple lines on a braille notetaker. Students who had chemistry class were amazed that they could see the entire equation at once and were able to edit it on the Monarch.”
Pre-teaching would likely be necessary for accessing graphics on the Monarch, according to Bliss. Her students explored how the Monarch displays graphics on its 10 line by 32 cell display using graphics from APH’s Tactile Graphic Image Library (TGIL), where there is a collection of science graphics. A hard copy of the TGIL diagram of the butterfly life cycle was used with an occluder to show students how a section of the diagram was displayed at one time on the Monarch. Students who were advanced in their use of tactile graphics understood that once they zoomed in on the Monarch, they were viewing a part of the graphic instead of the whole one. This concept was familiar to students as they are always using “part to whole” strategies to understand a hard copy graphic—the Monarch just makes this process a dynamic one.
Jennifer mentioned that students repeatedly said they now understood “zooming,” “scrolling” and “double tapping” from the sighted world and most became experts and enthusiastic advocates of “point and click.” She is excited about the possibilities for graphics to be created for this environment specifically. For instance, tactile graphics that could be linked together so that when viewing the butterfly life cycle, one might tap on the chrysalis and go to a detailed picture. In addition, graphics might possibly be created that fit into the Monarch’s output screen. In the meantime, Jennifer said that educational teams will need to consider the balance between producing hard copy tactile graphics (with the entire graphic on one page) or receiving graphics immediately on the Monarch (with scrolling and zooming required to see the entire graphic).
Jennifer also mentioned the future of eBraille and its use on the Monarch. “Most science content is now online and the day of a ‘science textbook’ is nearly a thing of the past,” said Bliss, “eBraille will hopefully create an environment where graphics can be viewed somewhat seamlessly within the online content.” Today, students typically use hard copy graphics along with a screen reader to access online curriculum.
Biology is another area where Jennifer sees the potential for development on the Monarch. “Dissections in biology can be challenging,” Jennifer said. “The sighted students are looking at something that’s difficult for our students to touch and understand. What I imagine is a set of linked diagrams created for the Monarch so instead of numerous hard copy diagrams, students have dynamic access. It would be powerful to be able to “zoom in” and just see where the heart exists relative to the lungs.”
The Monarch’s application that Jennifer feels is a game changer is the graphing calculator (Keymath) that gives students the ability to create dynamic views of data in a tactile form. When Jennifer’s students used the graphing calculator to enter a few equations, they were amazed to see the graph produced instantly. Currently, students must create graphs manually (which is a time-consuming endeavor) or use accessible online apps which can read data points and sonify the graph.
The Monarch will be available to the public as well as for purchase using federal quota funds in September 2024. Stay tuned to the website, APH News, and your email inbox to find out when the device will be for sale.

Chemistry is a complex subject. Students study a variety of concepts, such as atomic structures, electron configurations, the periodic table,...